Using Python in Power BI
Microsoft announced Python integration in Power BI in their August feature summary. Just as with the R support you can now use Python for importing data, data transformation and data visualization. In this article we will step by step prepare a Python environment, enable Python in Power BI, import data and apply clustering to the data and create custom visuals in Power BI using Python. All material needed to replicate this example is available in GitHub. The article assumes that you have a working Python environment and Power BI installed.
Creating the data import script in Python
The dataset that we’ll be working with is the Boston Housing dataset, which is available in scikit-learn. The dataset is most often used for examples in regression but we’ll take a different approach and use it for clustering. We will use Principal Component Analysis to reduce the dimensions in order to visualize the data in a 2-dimensional space. After this we will apply k-means clustering to try to identify any homogenous groups within the data.
I will not go through the steps taken to create the import code as the main focus of this article is to showcase using Python in Power BI. The data preparation phase is available as an Jupyter Notebook for those who are interested to see how it was created. I recommend creating standalone scripts of the code that you are going to use in order to test and debug any problems prior to using it in Power BI. The error messages provided by Power BI are not always that informative.
Enabling Python in Power BI
Set-up Python virtual environment with required libraries
There are several ways to manage your Python (virtual)
environments. In addition to
virtualenv and pipenv you can also use the conda distribution.
In this example I’m using pipenv to manage the
Python environment that Power BI will use. In order to get started open a
Command Prompt or Power Shell console and navigate to the folder that you
want to use as a working directory for your Python code. Go to the location
where you have cloned/downloaded the example code from my GitHub repository if
you are using that. We will run the following command in order to create the
Python environment and install the required libraries.
pipenv install numpy pandas matplotlib seaborn scikit-learn
In case you are using my code from GigHub is is enough to run pipenv install
as it will automatically install the required libraries from the existing
Pipfile.
Lastly, we want to check the actual Python path for this virtual environment since we will need to refer to that from Power BI.
pipenv --venv
The location of my virtual environment was
C:\Users\tomra\.virtualenvs\python_and_powerbi-0r4DNLn9 so I copy that path
to the clipboard.
NOTE: You can use conda to manage a virtual environment for Power BI. In
case you’ve used similar conda installation/configuration as me, the conda
environments are installed in a system folder in Windows
%userprofile%\AppData. As default you cannot navigate to this folder from the
Power BI to choose your Python home directory. A workaround for this is to show
hidden files in Windows Explorer. Just be aware of the implications that you
don’t accidentally remove any system files in regular Windows usage. Another
option is to place the conda environments in a non-system folder.

Configure Power BI to use Python
The Python support in Power BI is still a preview feature (as of December
2018), which means that we will need to enable it separately before it can be
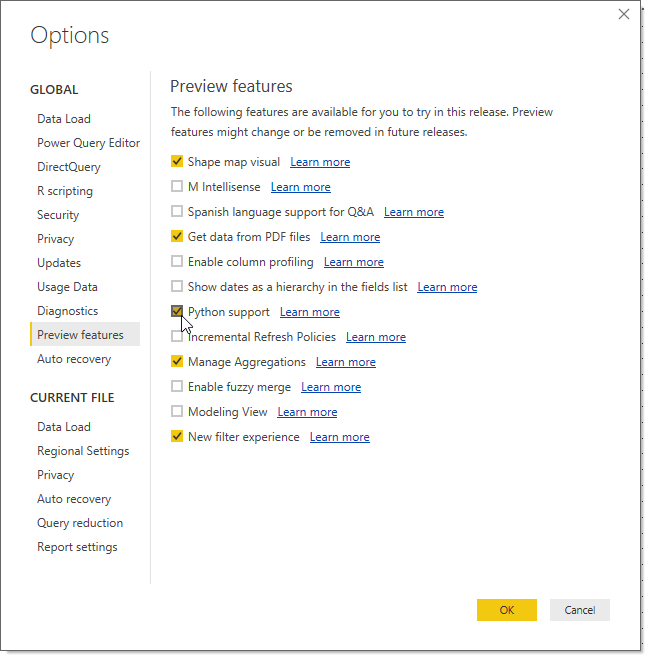
used. Start Power BI and go to the Options and Preview features section.
From there we can enable Python support. Click OK and restart Power BI.
We go back to the Options. This time you should see a Python scripting
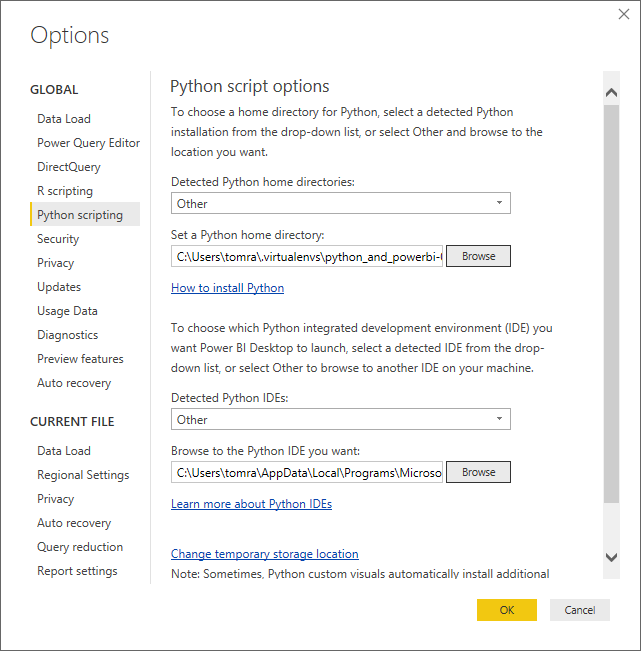
section on the left. Click on that to open the Python script options. As
default Power BI lists the Python environments is has been able to detect in
the system. We will need to change these settings since we created a separate
virtual environment for Power BI. From Detected Python home directories
choose the Other option. Set the Python home directory to the Scripts
folder in the path where your virtual environment exists. In my case it is
C:\Users\tomra\.virtualenvs\python_and_powerbi-0r4DNLn9\Scripts.
Now we are ready to utilize Python code in Power BI so get ready!
Power BI
Importing data using a Python script
We go to the Home tab in the ribbon and click Get data and choose the
More option to start our data import. Go to the Other pane where you should
find the Python script option. Select that and click Connect. A Python
script dialog opens where you can add your own code. Copy and paste the below
code to the Script text area and click OK.
import pandas as pd
import numpy as np
from sklearn.datasets import load_boston
from sklearn.preprocessing import StandardScaler
from sklearn.decomposition import PCA
from sklearn.cluster import KMeans

# utilize the sklearn.datasets package to load the Boston Housing dataset
boston = load_boston()

# scale the data to same value range first since PCA
# is sensitive to the scaling of data
sc = StandardScaler()
X = sc.fit_transform(boston.data)

# create PCA with n_components=2 to allow visualization in 2 dimensions
pca = PCA(n_components=2)
X_pca = pca.fit_transform(X)

# divide data into 5 clusters (refer to .ipynb for motivation)
kmeans = KMeans(n_clusters=5, init='k-means++', max_iter=300, n_init=10)
y_kmeans = kmeans.fit_predict(X_pca)

# create pandas dataframe of the housing data for Power BI
columns = np.append(boston.feature_names, ['MEDV', 'PC1', 'PC2', 'CLUSTER'])
data = np.concatenate((boston.data,
                       boston.target.reshape(-1, 1),
                       X_pca,
                       y_kmeans.reshape(-1, 1)),
                      axis=1)
df_housing = pd.DataFrame(data=data, columns=columns)
# we need to convert all columns as string because of different
# decimal separator in Python (.) and Finnish locale (,) that Power BI uses.
# comment out below line if Power BI uses dot as a decimal separator.
df_housing = df_housing.astype('str')

# create pandas dataframe of the pca data for Power BI
columns = np.append(boston.feature_names, ['VARRATIO'])
data = np.concatenate((pca.components_,
                       pca.explained_variance_ratio_.reshape(-1, 1)),
                      axis=1)
df_pca = pd.DataFrame(data=data, columns=columns, index=['PC1', 'PC2'])
df_pca = df_pca.astype('str')
In the next window we are able to choose which datasets to import. Select both
the df_housing as well as the df_pca datasets and click Load. Next we
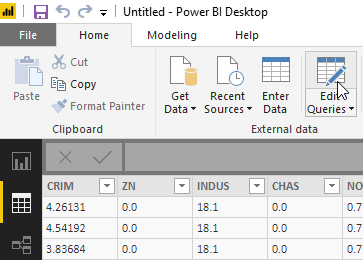
will go and make the final adjustments to our import data. Click Edit Queries
in the ribbon.
Because of the possible difference in your locale settings in Python and Power BI I chose to save all columns as strings in the Python script. The correct data types needs to be set and depending on your locale/settings we might need to take different routes. The target is to convert every column to numbers.
Power BI with decimal point
Although I have not tested this, you should be able to remove the
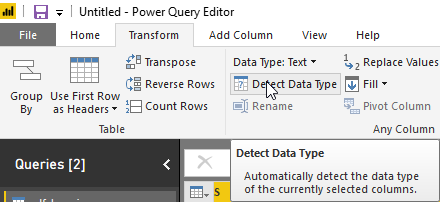
Changed Type step, choose all columns and let Power BI Detect Data Type from
the Transform tab in the ribbon in order to get the correct data types. Repeat
for both datasets.
Another option is to modify the import script and remove/comment the rows where
we set the data type as strings df_housing = df_housing.astype('str') and
df_pca = df_pca.astype('str'). Power BI should identify the data types during
import correctly.
Power BI with decimal comma
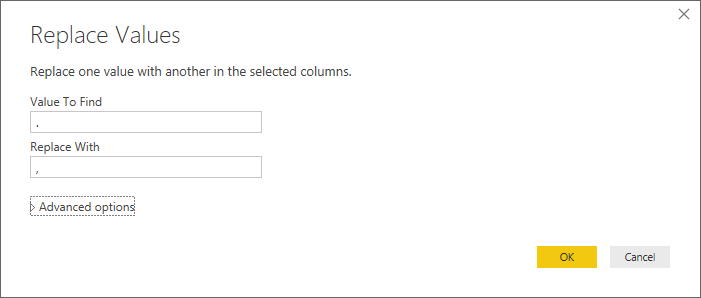
We need to replace the decimal separator from dot (.) to comma (,) in order to
set the correct data type. Choose all columns and click Replace Values from
the Transform tab in the ribbon. Replace dot with comma and click OK.
After this let Power BI detect the correct data type by clicking Detect Data Type. Repeat these steps for both datasets.
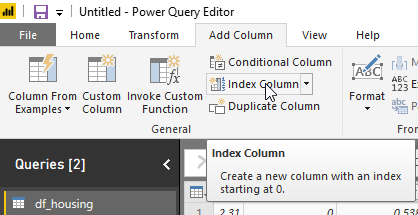
The final step is to add an Index Column to the df_housing dataset. This
can be done from the Add Column tab in the ribbon. When that has been done go
to the Home tab and click Close & Apply.
Create custom visualizations using Python
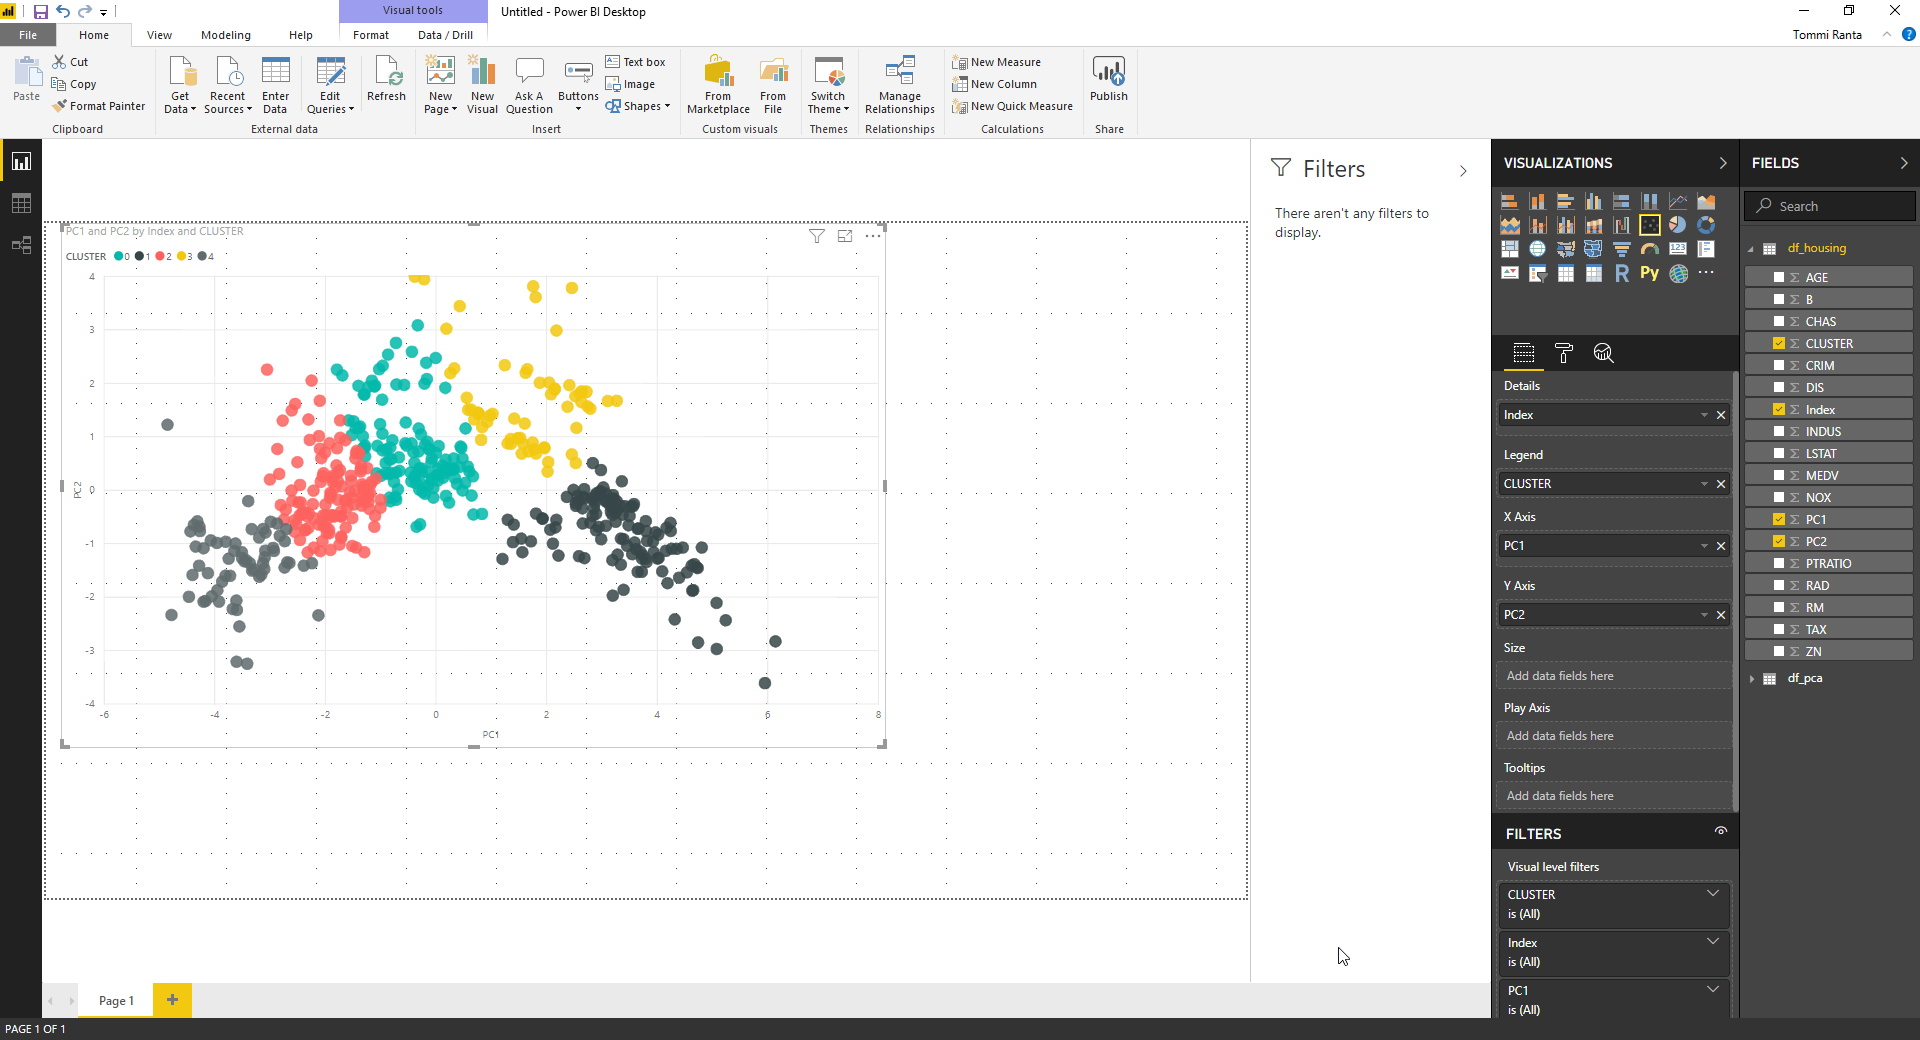
We go back to the Reports view to start working on our visualizations. The
plan is to visualize the clusters on a chart using the principal components as
axes. A scatter plot is a good alternative for this visualization. Click on the
Scatter chart to add it to the page. Drag the df_housing columns to the
visualizations pane in the following way:
- Drag
PC1to theX Axis. - Drag
PC2to theY Axis. - Drag
CLUSTERto theLegendto visualize how the clusters are grouped. - Drag
IndextoDetailsas this will remove the aggregation in the chart.
The end result should look something similar to the picture below. You might have a different cluster order (coloring) due to the random selection of initial centroids in the k-means clustering.
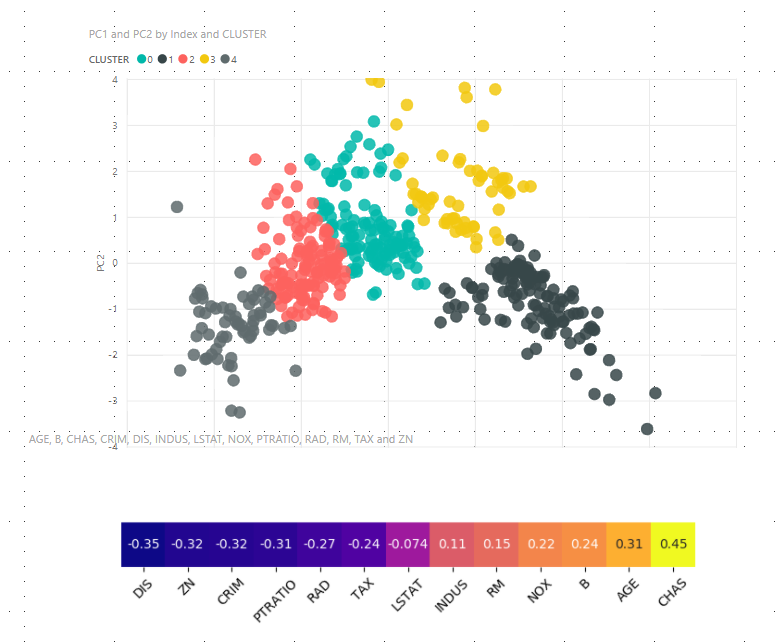
Next we will visualize how each feature affects each of the principal
components. This information is available in the df_pca dataset. We will show
this information through a heatmap. The Seaborn Python library provides an
easy way to create a heatmap so we’ll add a Python visual to the page. Power
BI might warn you about script visuals, click Enable to continue. Each
feature needs to be separately dragged to the Data fields area. Drag each
column from the dataset except VARRATIO. Copy the following code snippet to
the code area and click Run script.
import matplotlib.pyplot as plt
import seaborn as sns

dataset.index = ['PC1', 'PC2']
plt.figure(figsize=(8, 2))
plt.xticks(rotation=45)
data = dataset.loc['PC1', :].to_frame().sort_values(by='PC1').transpose()
sns.heatmap(data,
            cmap='plasma',
            square=True,
            annot=True,
            cbar=False,
            yticklabels='')
plt.show()

You should now see a heatmap similar to the figure below. Depending on your screen resolution you might have to hide the script pane to see the visual.
Repeat the same step to create a heatmap for the second principal component but use below code snippet instead to use the data from the second principal component and make a vertical visualization that can be placed on the left side of the scatter plot.
import matplotlib.pyplot as plt
import seaborn as sns

dataset.index = ['PC1', 'PC2']
plt.figure(figsize=(2, 8))
data = dataset.loc['PC2', :].to_frame().sort_values(by='PC2', ascending=False)
sns.heatmap(data,
            cmap='plasma',
            square=True,
            annot=True,
            cbar=False,
            xticklabels='')
plt.show()
I recommend testing your Python visuals in some other tool e.g. using Jupyter Notebook especially in cases where the visualization is complicated or you want to fine-tune all the small details of the visualization. It’s also worth considering to use the same fonts in your Python visualization as in the Power BI report to have a unified look & feel. This is quite easy to achieve with Matplotlib and its siblings.
NOTE: Some python packages only generate HTML, to overcome this limitation,
the plot is saved as an image and then displayed using matplotlib. To write to
png you need to install chrome driver and e.g. place the exe in
C:\chromedriver. Once you have done this you should this folder in the PATH
environment variable. This step is not needed in our case.
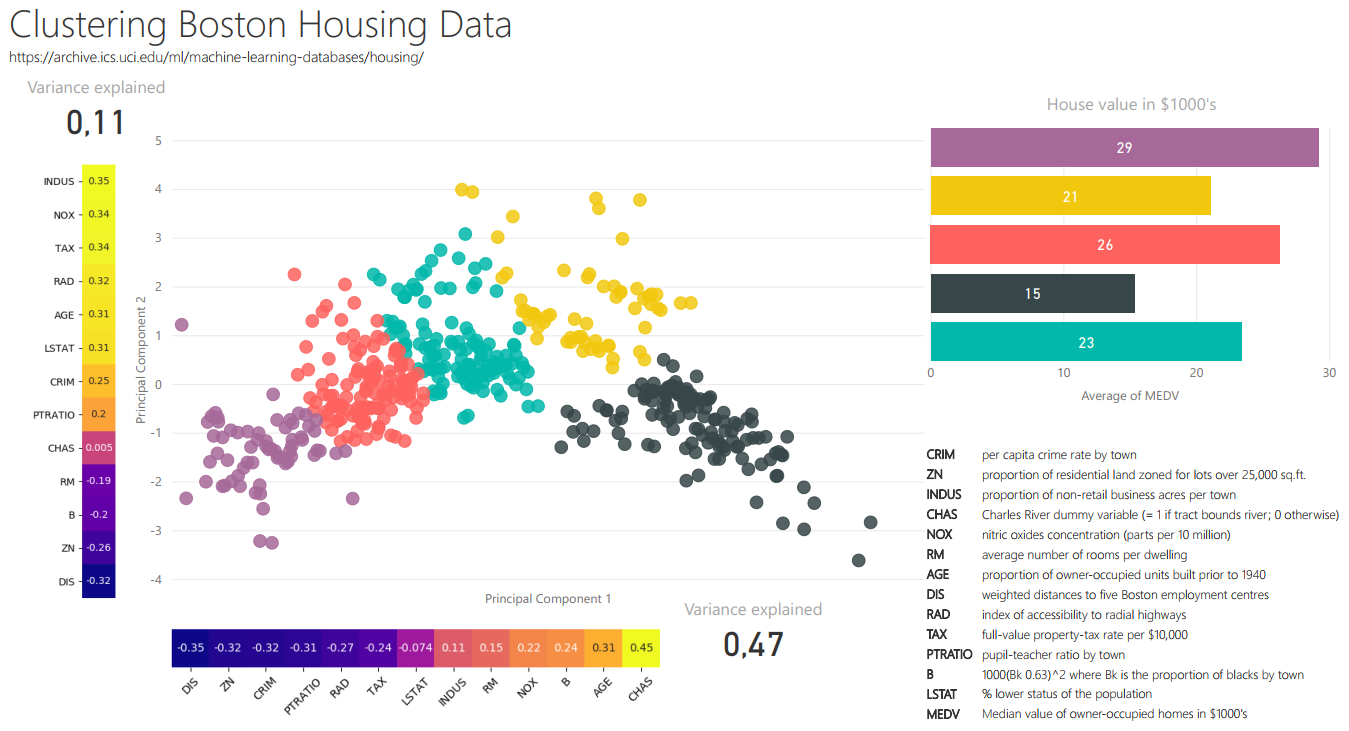
We have now visualized the identified clusters of data with regards to the two principal components that together explain the majority of the variance in the data. The heatmaps display which features affects each principal component in a positive or negative manner with regards to the principal component value. Let’s make some final touches to make the report look a little nicer:
- Change one of the gray cluster colors to purple.
- Add a heading and reference to data.
- Add a visualization that shows the average median price per cluster.
- Add a text box explaining the features.
- Add a visualization stating the variance explained for each principal component.
This is how my version ended up looking.
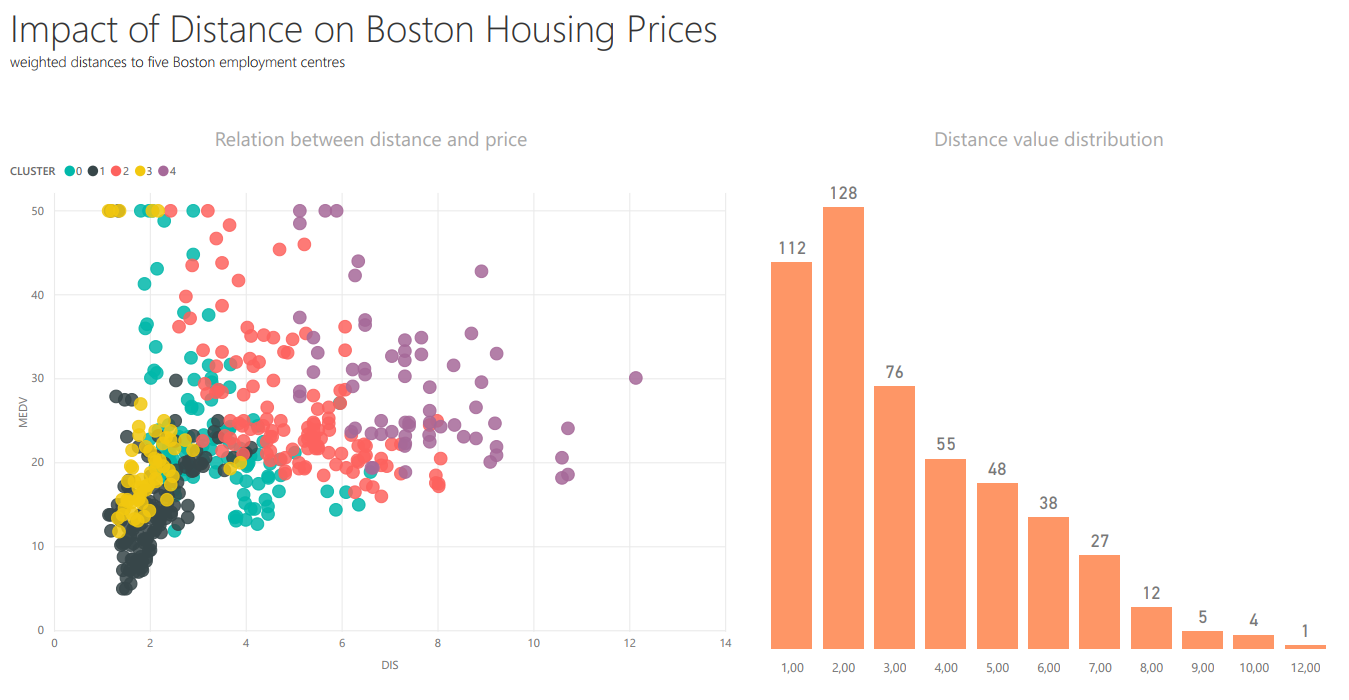
To top it off we’ll just create one more report where we take a closer look at
the relation between a chosen feature, median housing value (target) and the
identified clusters. By looking at the visualization we can conclude that the
first principal component alone explains almost half of the variance in the
data. In addition, we can see from the charts that lower principal components
values translate to a higher median house value on average. The Distance
feature has the biggest impact for lowering the PC1 value by a small margin, so
let’s have a closer look at that to see how it behaves in the different
clusters. We create a new page and do the following changes:
- Add a descriptive heading.
- Add a
Scatter chartwithX Axisvalue isDIScolumn,Y Axisvalue isMEDVandLegendandDetailsfields are set up like the previous scatter plot. - Right click the
DIScolumn and chooseNew groupand create bins of size 1. - Add a
Stacked column chartshowing the distribution of distance values by using the newly created binned column ofDIS. Sort the chart in ascending order by the Axis instead of the count.
This is how my version of the report turned out.
Summary
In this article we have set-up a Python virtual environment and installed the required libraries for data transformation and visualization. You can install additional libraries to the environment if there is some Python library you want to utilize. Next we set-up Power BI to utilize Python scripts. This was a one-time setup, which means that you don’t have to repeat these same steps with your next report. Finally, we utilized Python scripts for importing data and creating custom visuals. There is also possibilities to use Python scripts for data cleaning & transformations for datasets that have already been imported to Power BI. It remains to be seen in what use cases it makes sense to utilize Python scripts within Power BI versus preparing the data outside Power BI and importing a dataset that is ready for visualization. Also the performance of the Python visuals could be better. But keeping in mind that this is still a preview feature it looks very promising! What use cases do you see for using Python in Power BI? Join the discussion and share your thoughts.