Statistics for Business Analytics Summary
This is a summary of the equations and examples from the Udemy course Statistics for Business Analytics A-Z™ held by Kirill Eremenko.
It contains information about:
- Distributions
- Central Limit Theorem
- Z-Test
- T-Test
- Hypothesis testing & statistical significance
- 1-tailed and 2-tailed test
You can find a link to the course here.
Distributions
Continuous vs. Discrete Values
A continuous variable is one which can take on infinitely many, uncountable values. E.g. height, weight, length, time
A discrete variable over a particular range of real values is one for which, for any value in the range that the variable is permitted to take on, there is a positive minimum distance to the nearest other permissible value. E.g. number of items, dice results, shoe size.
Source: Wikipedia
Types of distributions
In a discrete distribution the value belongs to a certain category or group. It is possible to calculate the probability for a certain value ending up in a specific category.
A continuous distribution is represented by a line consisting of all the values in the sample/population. It is not possible to calculate the probability for a certain value. Instead one must calculate the probability of a value belonging into a certain area.

Normal distribution
The normal distribution is also known as the Gaussian distribution or the Bell curve (although there a many other distributions that take the form of a bell as well).
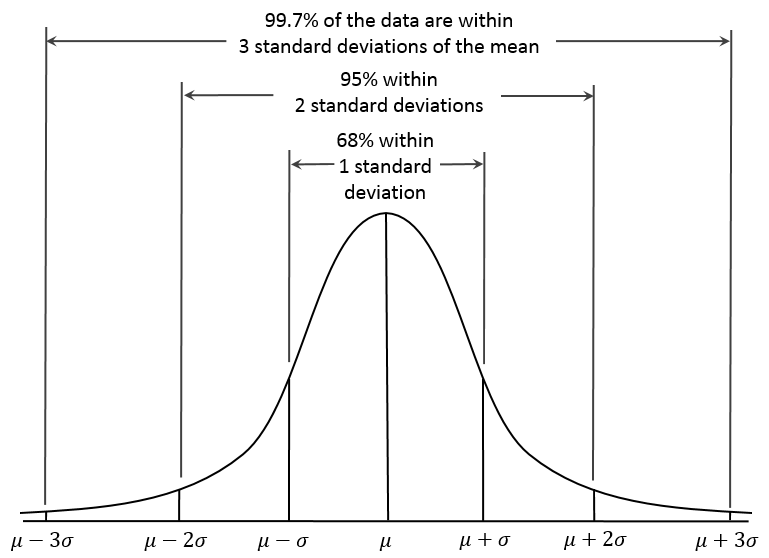
Image source: Wikipedia
Skewness
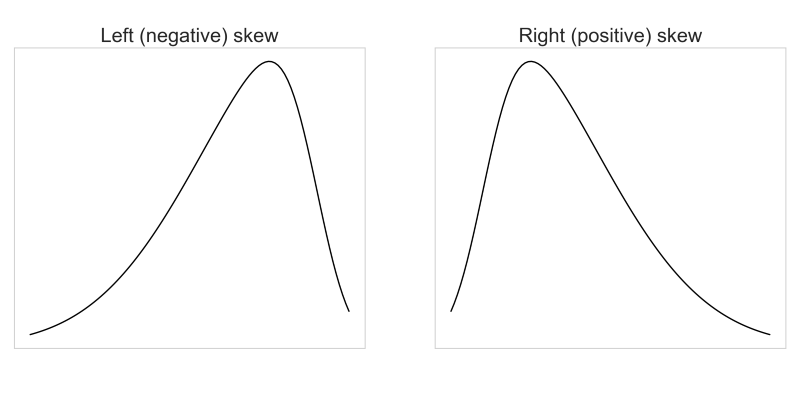
Skewness is a measure of the asymmetry of the distribution of values in a distribution. The skewness can be both positive or negative. A left skewed has outlier values with regards to the distribution in its tail (left side of the distribution), whereas a right skewed distribution has its outliers to the right side of the distribution.
Mean, median, mode
Given a distribution of the following values:
[2, 2, 3, 3, 4, 5, 6, 7, 7, 8, 8, 8, 8, 9, 10]
Mean value is the average of the sum of all values (=6 in the above example).
Median is the value in the middle of the index of the sorted distribution (=7 in the above example. Value at index position 8, as the size of the distribution is 15). In case there is an even number of values in the distribution the median value is the average of the two middlemost values.
Mode is the most frequent value (=8 in the above example).
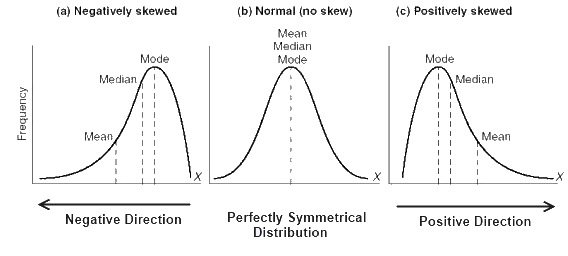
Image source: Stackexchange
Central Limit Theorem
Population and sample
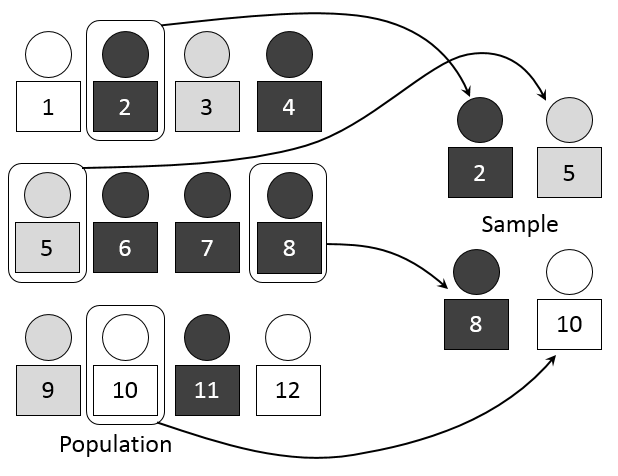
Image source: Wikipedia
Population parameters
\[N = \text{size} \\ \mu_\ = \text{mean value} \\ \sigma = \text{standard deviation}\]Sample statistics
\[n = \text{size} \\ \bar{x} = \text{mean value} \\ s = \text{standard deviation}\]Central limit theorem
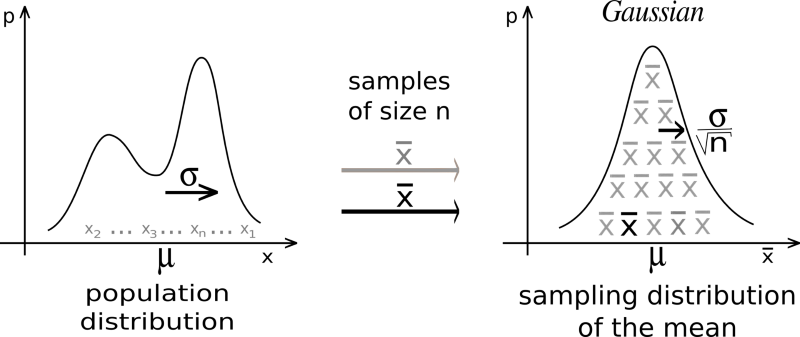
Image source: Wikipedia
Sampling distribution
The standard deviation of a sampling distribution is
\[\sigma_\bar x = \frac {\sigma} {\sqrt{n}}\]where
\[\mu_\bar x = \mu = \text{mean value} \\ \sigma = \text{standard deviation of the population} \\ n = \text{sample size}\]Z-score
One sample
Given a value x one can calculate the Z value
\[z_i = \frac {x_i-\mu} {\sigma}\]where
\[\mu\text{ is the mean of the population} \\ \sigma\text{ is the standard deviation of the population}\]Sample distribution
Given a mean value x
\[z = \frac {\bar x-\mu} {\sigma_\bar x}\]where
\[\mu\text{ is the mean of the population} \\ \sigma_\bar x\text{ is the standard deviation of the sample}\]Z Table
Z-score example
You are a Business Analyst working for a delivery services company.
A business client has requested a large freight to be transported urgently from Denver to Salt Lake City. When asked about the weight of the cargo they could not supply the exact weight, however they have specified that there are a total of 36 boxes.
From prior experience with this client you know that this type of cargo follows a distribution with a mean of 72 lb and a std. dev. of 3 lb.
The only plane you currently have at Denver is a Cessna 208B Grand Caravan with a max cargo weight of 2,630 lb.
Based on this information what is the probability that all of the cargo can be safely loaded onto the plane and transported?
\[\mu_\bar x = \mu = 72 \\ \text { } \\ \sigma_\bar x = \frac {\sigma} {\sqrt{n}} = \frac {3} {\sqrt{36}} = 0.5 \\ \text { } \\ \text{Plane capacity} = 2,640 lb \\ x_{crit} = \frac {2,640\ lb} {36\ boxes} =\ 73.06\ lb/box \\ \text { } \\ z = \frac {x_{crit} - \mu_\bar x} {\sigma_\bar x} = \frac {73.06-72} {0.5} = 2.12 \\ \text { } \\ P(x<x_{crit}) = 0.9830 = 98.3\ \% \\ \text{ } \\ \text{Conclusion: There is a } 98.3 \% \text{ chance that the plane can take off.}\]Hypothesis testing & statistical significance
Hypothesis testing
- State the null hypothesis H0 (current state).
- State the alternative hypothesis H1.
- Calculate the z-score
- Check the P-value based on the z-score
- Given a certain confidence level (usually 95%), either reject the null hypothesis or conclude that there is not sufficient evidence to reject the null hypothesis.
Hypothesis testing example
In 2015 millennials were watching 26.5 hours of TV a week with a std. dev. of 10 hours. Today you surveyed 50 millennials that they watch 24 hours of TV per week. Has the parameter decreased?
\[H_0: \text{It has not decreased, i.e. } \mu \ge 26.5 \\ H_1: \text{It has decreased, i.e. } \mu \lt 26.5 \\ \text { } \\ \mu_\bar x = \mu = 26.5 \\ \text { } \\ \sigma_\bar x = \frac {\sigma} {\sqrt{n}} = \frac {10} {\sqrt{50}} = 1.41 \\ \text { } \\ \bar x = 24 \\ \text { } \\ z = \frac {\bar x - \mu_\bar x} {\sigma_\bar x} = \frac {24-26.5} {1.41} = -1.77 \\ \text { } \\ P = 0.0384 = 3.84\ \% \lt 5\ \% \\ \text { } \\ \text{Conclusion: We can reject } H_0 \text{ with a 95 % confidence}\]Rejection regions
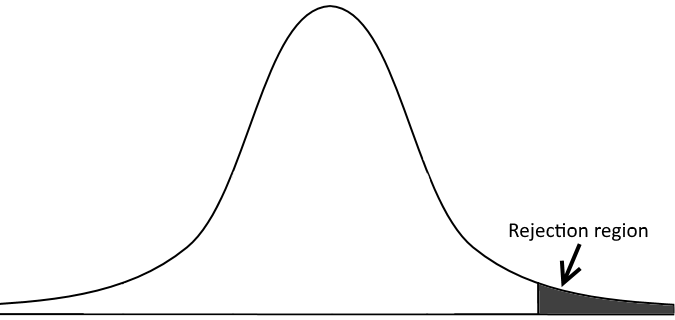
Instead of checking whether the P-value for a certain z-score is under/over the selected confidence level we can define rejection regions and compare our calculated z-score against the z-score for P critical.
Rejection regions example
\[P_crit = 0.05 = z_crit = -1.65\]In above example the value -1.77 is less than -1.65, which means that our value is within the rejection region. Note in case z-score is positive the z-score must be higher than z critical in order for the value to be in the rejection region.
Common rejection region values
| Confidence level | P critical | z critical |
|---|---|---|
| 95% | 0.05 / 0.95 | -1.65 / 1.65 |
| 97% | 0.03 / 0.97 | -1.88 / 1.88 |
| 99% | 0.01 / 0.99 | -2.33 / 2.33 |
Student’s t-distribution
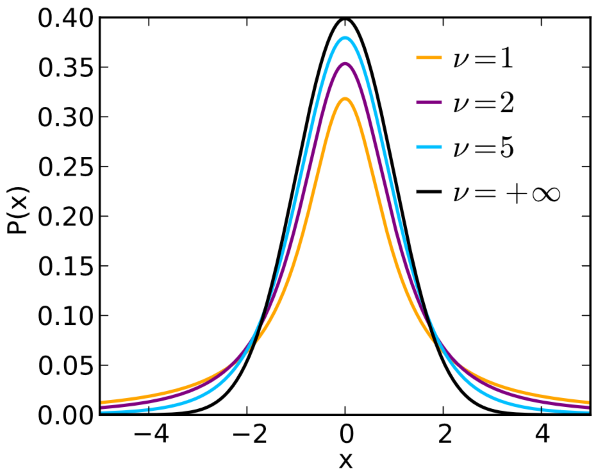
The t-distribution can be used instead of the normal distribution for smaller data sets (sample size < 30). The caveat is that it has heavier tails.
T-Test
T test can be used in situations where the sample size smaller than 30. In case the sample size is bigger than that it is better to rely on the Z-test calculation.
The t value is calculated with the following formula.
\[t = \frac {\bar x - \mu} {(\frac {s} {\sqrt{v}})}\]where
\[\mu = \text{mean value of the population} \\ s = \text{standard deviation of the sample} \\ \bar x = \text{mean value of the sample} \\ v = \text{number of degrees of freedom} = number\ of\ samples -1\]Look for the t critical value in the t table according to confidence level, number of degrees of freedom as well as whether the the test is one tailed or two tailed. Compare t critical with the calculated t value as with the rejection regions.
t Table
T-test example
It is recommended to walk 10,000 steps a day to be healthy. You are wondering if on average Americans are meeting this recommendation. You surveyed 10 random people about how many steps each of them takes per day on average and got the following responses:
- 7,900
- 8,200
- 11,350
- 10,150
- 8,200
- 9,600
- 6,950
- 6,200
- 8,950
- 8,450
It is evident that within your sample on average respondents are taking less than 10,000 steps. But can you infer the same for the whole population of America?
\[H_0: \text{# of steps is at least met, i.e. } \mu \ge 10,000 \\ H_1: \text{# of steps is not met, i.e. } \mu \lt 10,000 \\ \text { } \\ \mu = 10,000 \\ \text { } \\ s = 1,428.36 \\ \text { } \\ \bar x = 8,595 \\ \text { } \\ t = \frac {\bar x - \mu} {(\frac {s} {\sqrt{v}})} = \frac {8,595-10,000} {(\frac {1,428.36} {\sqrt{9}})} = -2.95 \\ \text { } \\ t_{crit\ 0.95,v=9} = -1.833 \\ \text { } \\ t < t_{crit\ 0.95,v=9} \\ \text{ } \\ \text{Conclusion: We can reject } H_0 \text{ with a 95 % confidence}\]1-Tailed and 2-Tailed Test
One-tailed test is used to test statistical significance in one direction and two-tailed test is used to test statistical significance in two directions. A two-tailed test will test both if the mean is significantly greater than x and if the mean significantly less than x.
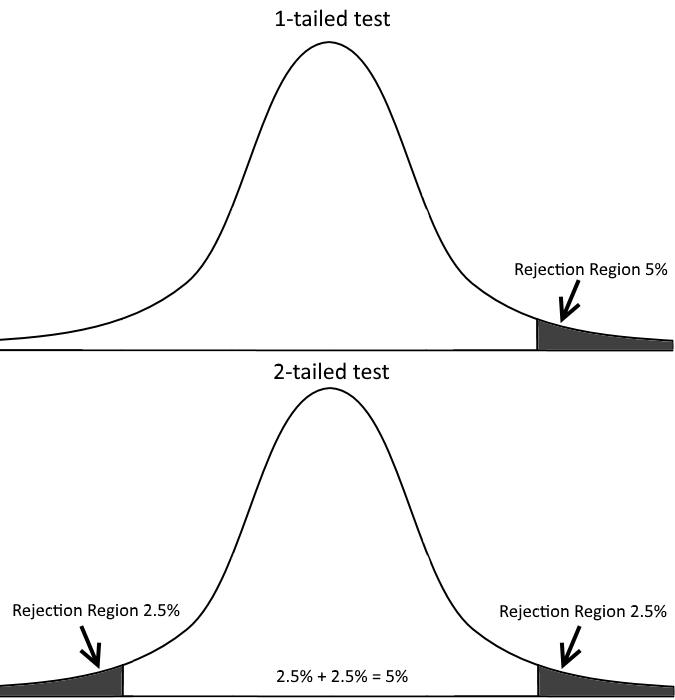
Notice the difference in hypothesis for a 2-tailed test.
\[H_0: \text{x has not changed, i.e. } \mu = value \\ H_1: \text{x has changed, i.e. } \mu \ne value\]